Legacy system modernization
Industrial HMI/SCADA platform rebuilt from the ground up
End-to-end redesign and rebuild of a legacy machine monitoring and control system for an industrial equipment manufacturer – from data ingestion at the machine level to operator dashboards, analytics, and reporting.
The challenge
The client operated a legacy HMI/SCADA system built on an outdated tech stack that had accumulated years of technical debt. Maintenance was costly and unpredictable, knowledge was concentrated in a handful of people, and extending the system with new features carried significant risk.
The system needed to keep serving its core purpose – monitoring and operating industrial machines across multiple customer sites – while being completely rebuilt on a modern, maintainable foundation.
Our approach
We designed the new system from scratch with a clear separation between data ingestion, business logic, and presentation. The architecture is modular – each subsystem (device management, telemetry, events, reporting, remote access) is independently deployable and testable.
We own the full data pipeline: from collecting raw telemetry and events directly off machines via MQTT and pulling files over FTP, through normalization and time-series storage, all the way to real-time dashboards and historical analytics. No third-party middleware – the entire ingestion and processing layer is purpose-built for the client’s device ecosystem.
Data pipeline
Full-stack data engineering
We built the entire data path from edge to dashboard. A custom gateway service connects directly to machines, normalizes heterogeneous telemetry into a unified schema, and writes to a time-series database optimized for high-frequency industrial data. The pipeline handles both real-time streams and batch file transfers, with built-in buffering and retry logic for unreliable factory network conditions.
What we built
Machine registry & configuration
Full lifecycle management of equipment – onboarding, metadata, connectivity settings, parameter definitions, and role-based access control per device.
Remote operator panel
In-browser remote desktop sessions (VNC) to on-machine HMI screens, enabling secure, role-gated remote control without VPN or dedicated software.
Real-time process monitoring
Live telemetry streams displayed as configurable dashboards with device-level status, alarm indicators, and operational KPIs refreshed in real time.
Data visualization & analytics
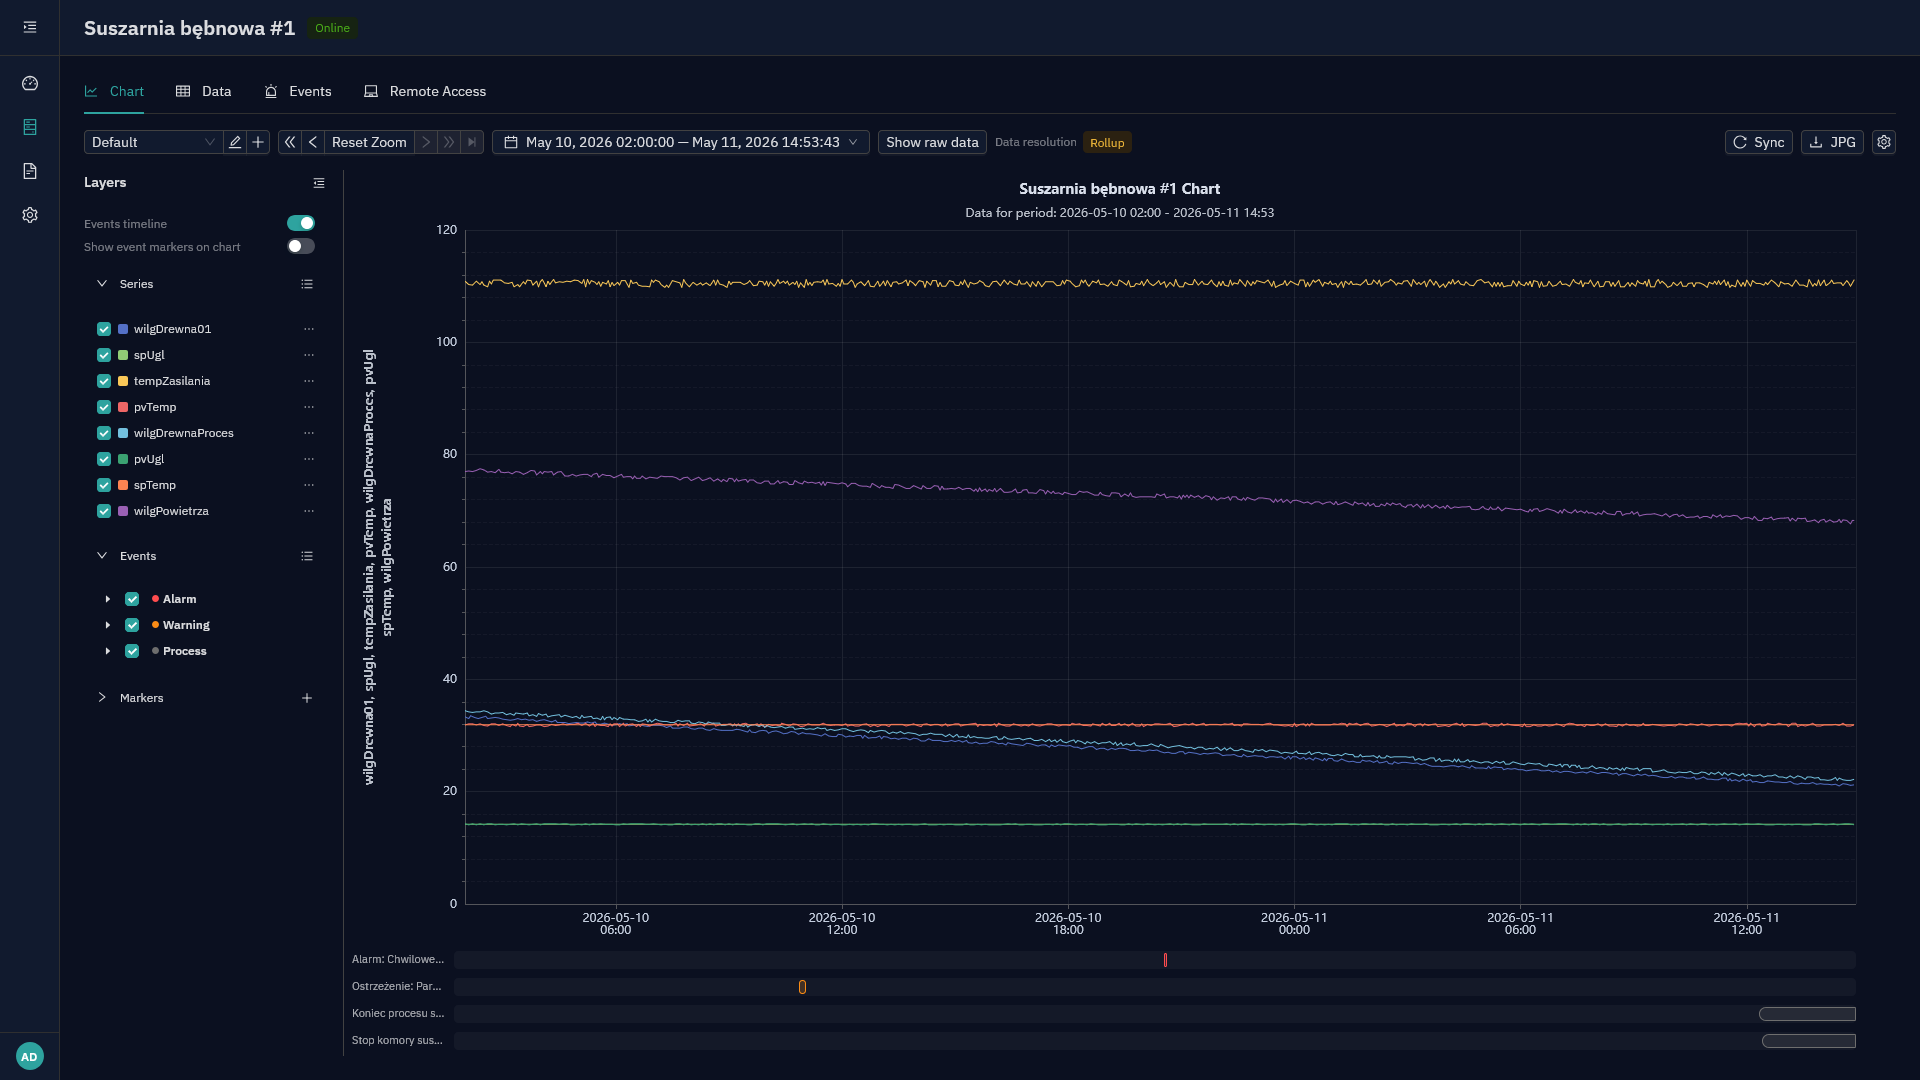
Interactive trend charts, historical tables with smart aggregation, statistical summaries, and time-aligned event timelines for traceability and root-cause analysis.
Reporting & data export
Template-based report builder with drag-and-drop sections – charts, data tables, event logs, metric summaries – exportable as PDF and spreadsheets.
Alarm & event center
Centralized event log with search, time-window filtering, category rollups, and alarm statistics – supporting compliance tracking and downtime analysis.
Outcome
The rebuilt platform preserves all critical functionality of the original system while running on a modern, testable architecture. Deployment is automated, the codebase is maintainable by a standard engineering team, and the modular design makes it straightforward to add new device types, data sources, or analytical features without risking the core system.